
TradingView indicators for Forex Gold Crypto
TradingView indicators for forex gold crypto traders should make chart planning clearer, not more complicated. Use this page to choose the right A.K Pro Traders tool for your workflow: Smart Money Concepts, the Toolkit and Multi-Timeframe Key Technical Levels. Built for clean structure, liquidity and key-zone trading across Forex, Gold (XAUUSD), indices and crypto markets. If you want the full brand overview first, visit our TradingView indicators homepage.
For Gold traders, pair this indicator workflow with the XAUUSD position size calculator so each setup is supported by proper risk sizing before execution.
Is this for you? (click to expand)▾
✅ Who it’s for
- • Intermediate/advanced traders using structure, zones and confirmation.
- • Traders who want confluence across timeframes on Forex, Gold, indices and crypto.
- • Traders who prefer clean rules, less guessing and repeatable workflows.
❌ Who it’s not for
- • Beginners wanting instant buy/sell arrows without learning.
- • Anyone expecting “set and forget” guaranteed-profit automation.
- • Traders who ignore risk management and consistency.
Educational tools only. Always use your own judgement and proper risk management.
Quick indicator workflow planner
Choose the right TradingView indicator for your market and setup
Use this comparison before opening a chart. It helps Forex, Gold and crypto traders match the indicator to the job: structure, execution timing, or higher-timeframe context.
1. Map structure
Use Smart Money Concepts when the setup depends on BOS/CHOCH, liquidity sweeps, FVGs and premium/discount zones.
2. Clean execution
Use the Toolkit when you want a cleaner TradingView overlay for confluence, entries and repeatable trade management.
3. Confirm key levels
Use Multi-Timeframe Key Technical Levels when your trade needs higher-timeframe support, resistance and zone context.
Built to be used natively on TradingView for structured technical analysis.
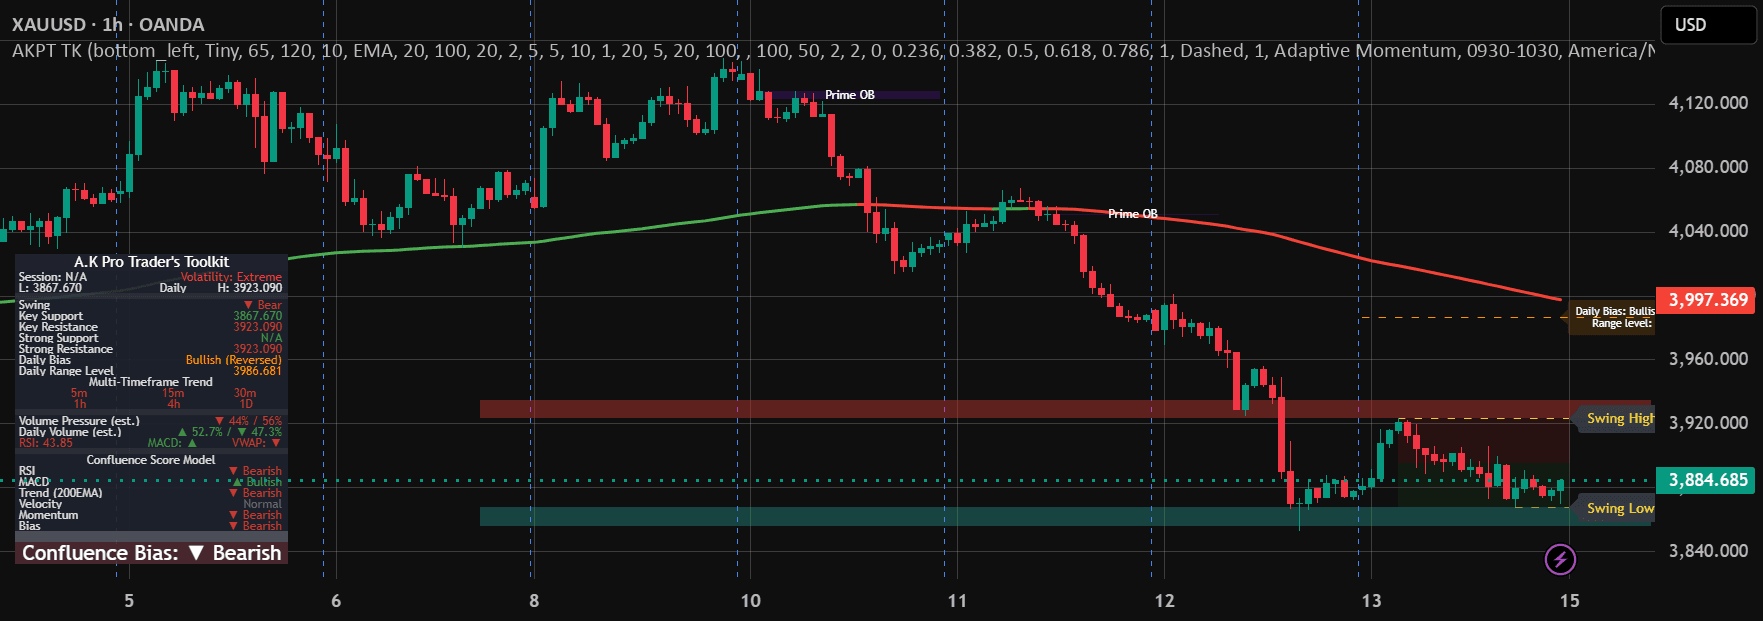
A.K Pro Trader's Toolkit
Multi-timeframe support and resistance, swing structure and a rules-based Confluence Bias dashboard in one overlay.
What it shows
- Support/resistance zones from 5m to daily, taken from completed higher-timeframe candles
- Swing highs/lows, order-block candidates and fair value gaps
- Dashboard with trend per timeframe, volume pressure (estimated) and a Confluence Bias score
Limitations
- The Confluence Bias is a rules score, not a forecast or a tested strategy
- Volume figures are estimates from candle direction, not real buy/sell order flow
- The current-day high/low updates live; other higher-timeframe levels change only when that candle closes
Best for: Traders who want one chart that shows levels, structure and context together.
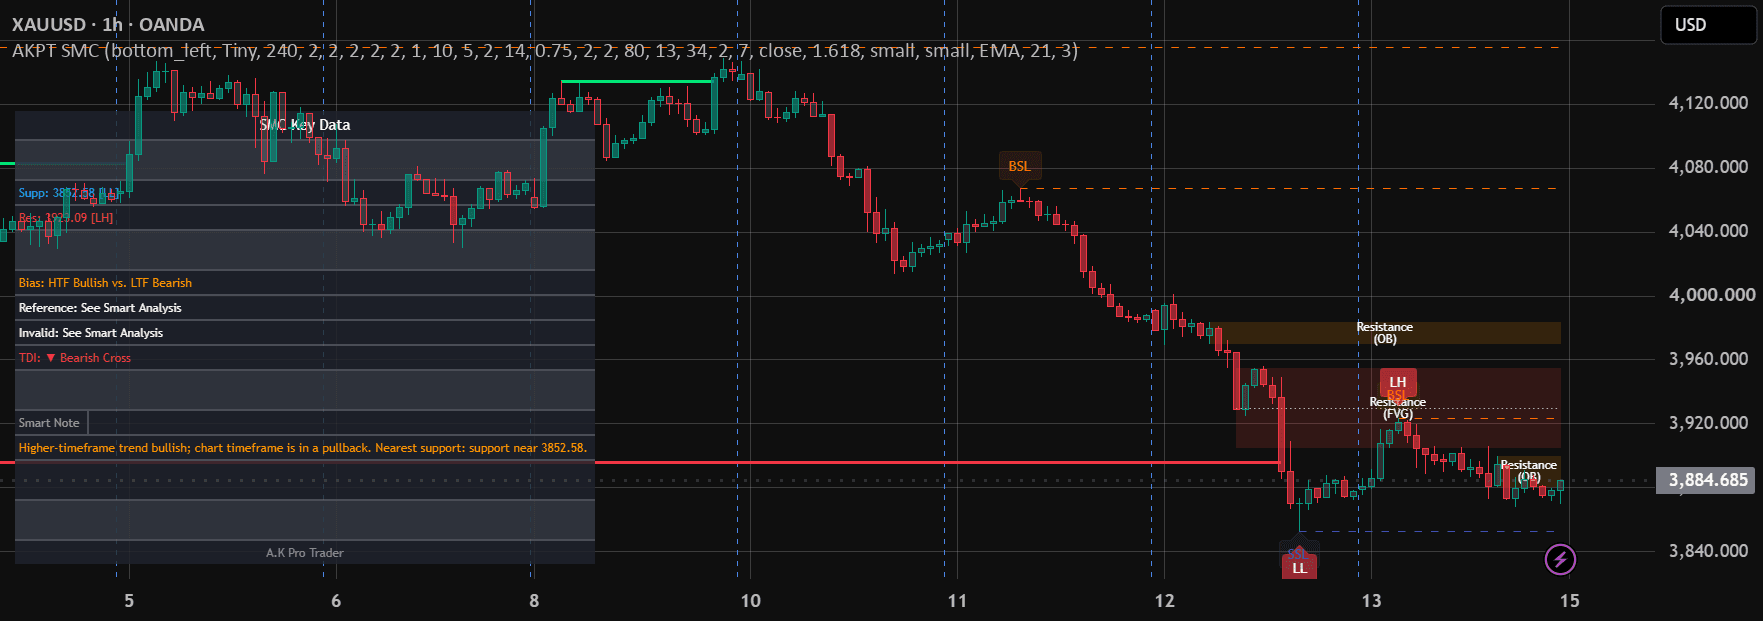
A.K Pro Trader's Smart Money Concepts
Pivot-based structure labels (BOS/CHoCH), fair value gaps, order-block and breaker candidates, liquidity levels and a dashboard.
What it shows
- Labels higher highs/lows and breaks of structure on candle closes
- Draws fair value gaps, order-block candidates and breaker blocks, with optional 5m to 4h zones
- Alerts for new zones, structure breaks, liquidity sweeps and zone invalidation
Limitations
- With default settings a swing needs 10 bars to its right before it is confirmed, so labels appear late by design
- "Smart Money" terms describe price patterns; the script cannot see institutional orders or who traded
- Trade Quality and Traffic Light are rules scores, not backtested win rates
Best for: Traders who already use market-structure and liquidity concepts.
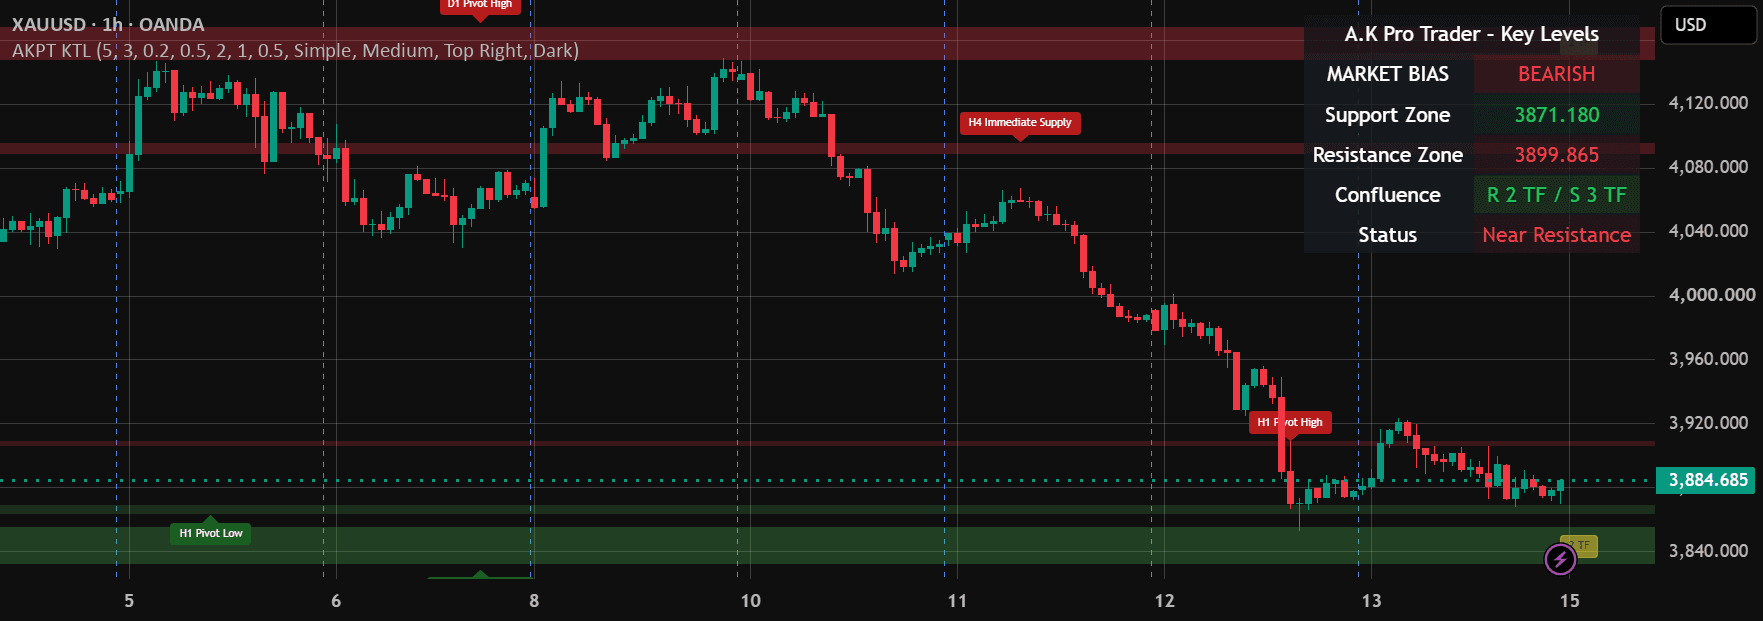
A.K Pro Trader's Multi-Timeframe Key Technical Levels
Support and resistance zones from daily, 4h, 1h, 30m, 15m and 5m data on one chart, with confluence counts and alerts.
What it shows
- Levels from range highs/lows, the previous candle and confirmed pivots of each selected timeframe
- Optional volume filter, ATR-sized zones and merging of overlapping zones
- Dashboard with nearest support/resistance and how many timeframes agree
Limitations
- Current zones are extended across the chart, including into the past; that is not evidence the zone was known earlier
- "Strong" and confluence labels describe the script's rules, not the chance of a level holding
- It gives no entries, stop-loss or position size; use your own risk controls
Best for: Traders who plan around higher-timeframe levels on any market.
Chart images are the current public TradingView publications (XAUUSD, 1 hour, OANDA). They show what the indicators draw, not a trading result. Trading involves risk of loss; these tools do not give financial advice.
Scenario support · Forex · Gold · Crypto
Example workflows for different market conditions
The indicators are not trade signals on their own. Use them as a structured decision stack so each setup has context, confirmation and risk planning before execution.
Forex trend continuation
- • Mark higher-timeframe direction with Key Levels.
- • Wait for BOS/CHOCH and liquidity context from SMC.
- • Use the Toolkit to keep execution zones clean.
XAUUSD liquidity sweep
- • Identify major Gold support or resistance first.
- • Look for swept highs/lows and FVG reaction areas.
- • Size the trade with the XAUUSD calculator before entry.
Crypto range reaction
- • Define range highs, lows and midpoint context.
- • Use SMC to avoid chasing after liquidity is taken.
- • Wait for confirmation instead of reacting to volatility alone.
Worked examples · Mistakes · FAQ
Practical examples for using these TradingView indicators
Strong chart analysis comes from matching the indicator to the market condition. Use the examples below to decide when to map structure, when to wait, and when to avoid forcing a trade.
Example 1: London Forex continuation
Start with Multi-Timeframe Key Technical Levels to mark the higher-timeframe direction, then use Smart Money Concepts to wait for BOS/CHOCH and liquidity context before looking for execution.
Example 2: XAUUSD sweep and reaction
For Gold, avoid entering just because price touches a level. Look for a swept high or low, confirm the reaction area, then use the XAUUSD position size calculator before risking capital.
Example 3: Crypto volatility filter
Crypto can move fast through obvious levels. Use the Toolkit to keep the chart clean, then wait for structure confirmation instead of chasing the first move after a breakout.
Common mistakes to avoid
- • Treating every indicator marker as a trade signal.
- • Ignoring higher-timeframe support, resistance and liquidity.
- • Using the same risk size on Forex, Gold and crypto without adjusting volatility.
- • Adding too many overlays until the chart becomes harder to read.
Supporting guides and tools
- • Smart Money Concepts indicator guide for structure, liquidity and FVG workflows.
- • Key Levels indicator guide for support, resistance and top-down planning.
- • SMC Daily Bias Tool for daily directional planning.
- • XAUUSD position size calculator for risk sizing before Gold entries.
Which indicator should beginners use first?
Start with the clearest need. If you struggle with structure, use Smart Money Concepts. If your chart is cluttered, use the Toolkit. If your entries lack context, start with Key Levels.
Can one setup work across markets?
The same planning process can work across Forex, Gold and crypto, but volatility and session behaviour are different. Always adapt confirmation and risk sizing to the market.
Do indicators replace risk management?
No. Indicators can make analysis clearer, but every trade still needs a planned entry, invalidation point, position size and exit logic before execution.